
Collapse of Phillips Curve in the USA (1971-91) –
During the sixties Phillips curve became an important concept of macroeconomic analysis. The stable relationship described by it suggested that policy makers could have a lower rate of unemployment if they could bear with a higher rate of inflation. On the contrary, they could achieve a low rate of inflation only if they were prepared to reconcile with a higher rate of unemployment. But a stable Phillips curve could not hold good during the seventies and eighties, especially in United States. Therefore, experience in the two decades (1971-91) has prompted some economists to say that the stable Phillips curve has disappeared.
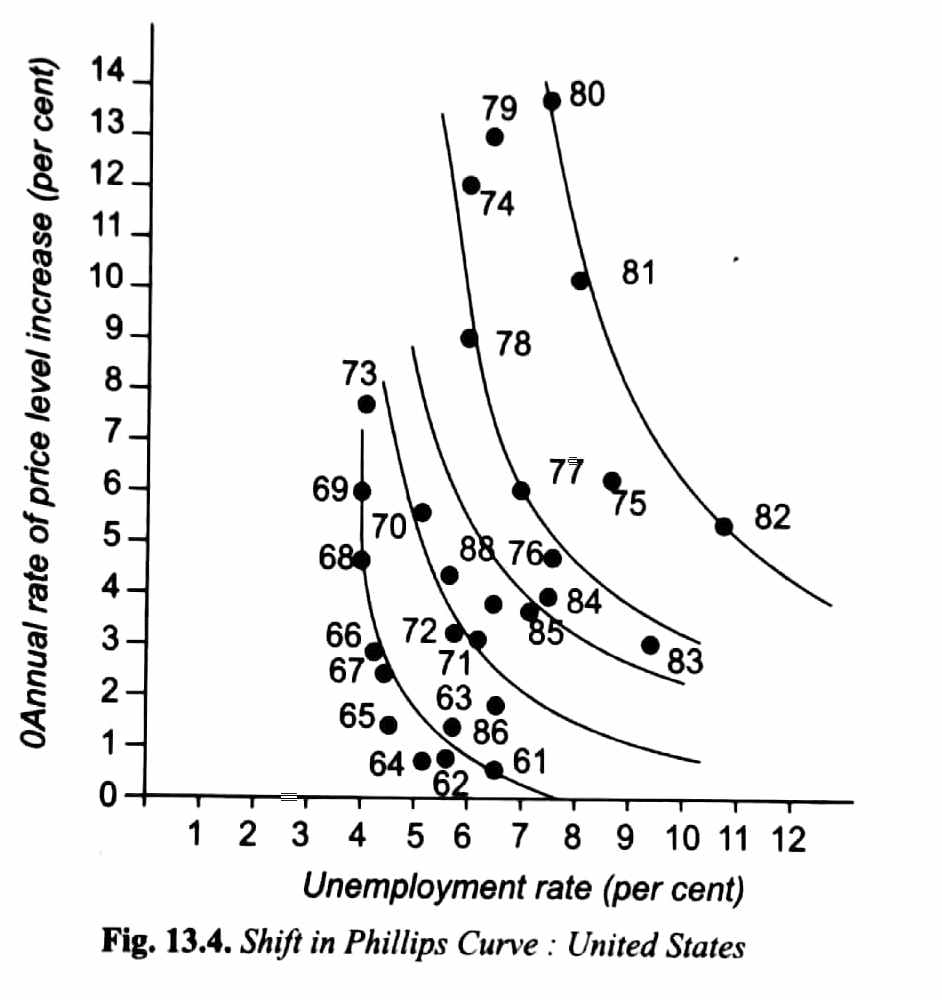
Fig.13.4 shows that data regarding the behavior of inflation and unemployment during the seventies and eighties in the United States do not conform to a stable Phillips curve.
In these two decades we have periods when rates of both inflation and unemployment increased (a high rate of inflation was associated with a high unemployment rate, which shows the absence of trade-off. It is shown from the data of inflation rate and unemployment in case of United States in fig. 13.4. From the data it appears that instead of remaining stable, the Phillips curve shifted to the right in the seventies and early eighties and to the left during the late eighties.
Causes of Shift in Phillips Curve –
According to Keynesians, the occurrence of higher inflation rate along with the increase in unemployment rate witnessed during the seventies and early eighties was due to the Adverse Supply Shocks in the form of fourfold increase in the prices of oil and petroleum products delivered to the American economy first in 1973-74 and then again in 1979-80.

In fig.13.5, where AD0 and AS0 are in equilibrium at point E and determine price level OP0 and aggregate national output OY0.
The hike in price of oil by OPEC, the cartel of oil producing Middle East Countries, brought about a rise in the cost of production of several commodities for the production of which oil was used as an energy input. Further the oil price hike also raised the transportation cost of all commodities.
The increase in the cost of production and transportation of commodities caused a shift in the aggregate supply curve upward to the left. This is generally described as Adverse Supply Shock which raised the unit cost of each level of output.
Due to this supply shock aggregate supply curve shifted to the left to the new position AS1 which intersects the given aggregate demand curve AD0 at point H. At the new equilibrium point H, price level has risen to P1 and output has fallen to OY1 which will cause unemployment rate to rise. So, we have a higher price level with a higher unemployment rate.
This explains the rise in the price level with the rise in the unemployment rate, the phenomenon which was witnessed during the seventies and early eighties in the developed capitalist countries such as the USA.
This has been interpreted by some economists as a shift in the Phillips Curve and some as demise or collapse of the Phillips curve.
